SmartPlantIQ Demo
For Pharma & Biotech Manufacturing

Continuous insight between every lab sample

SmartPlantIQ brings AI decision support to GxP manufacturing — PAT soft sensors that predict quality attributes between offline assays, deviation triage that cites your SOPs, and batch-record narratives written from live process data. Advisory-only by design: it never actuates your process.

Upstream & downstream · bioreactors · granulation & drying · utilities & clean media
smartplantiq.com/copilot — Bioreactor & Granulation Suite, live
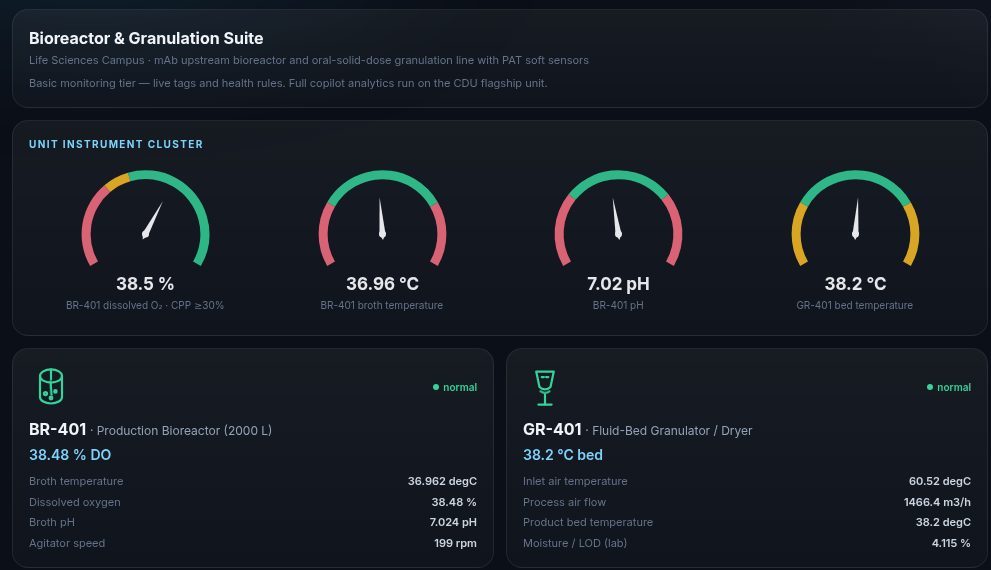
Live bioreactor and granulation suite: CPP gauges for dissolved oxygen, broth temperature, pH and bed temperature
The gap in your batch

Your process data is continuous. Your quality picture isn’t.

8–12 h

Blind windows between assays

Moisture, titre and potency are known only when the lab reports. Between samples, operators steer on experience — and drift is discovered after the fact.

Hours

Spent investigating deviations

Every excursion means exporting historian trends, reconciling alarms and hand-writing the rationale — repeated for every batch, on every shift.

Zero

Tolerance for unexplained AI

A recommendation you cannot trace to data and an SOP is unusable in a GxP area. Explainability is not a nice-to-have — it is the entry ticket.

PAT & soft sensors

Predict the quality attribute, continuously

Soft sensors model a critical quality attribute from the process tags you already record — giving a continuous predicted value between offline assays, with drift monitoring against every new lab result.

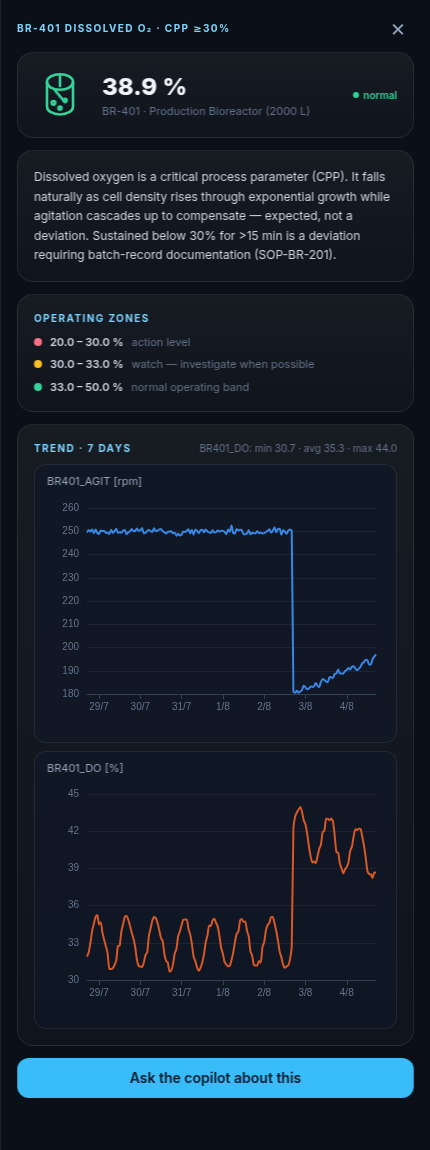
Bioreactor dissolved oxygen CPP drill-down: operating zones, SOP context and 7-day trends
Every metric drills down to its CPP band, the SOP context and the trend behind it — here the step change is a new fed-batch campaign starting. Soft-sensor panels add predicted vs lab and a DRIFT flag at 2σ, the trigger to retrain and requalify.

Granulation moisture (LOD)

Predicted from bed temperature, inlet air and airflow — see the drying end-point approach instead of waiting for the next LOD assay.

Upstream titre

Predicted from agitation, DO and pH across the fed-batch campaign — an early read on whether the batch is tracking its golden profile.

Monitoring only — by design

Predictions support decisions; batch disposition and release always use the validated laboratory assay. Every model records its features, coefficients, training window and residual sigma for change control.

See it on the live bioreactor
Deviation triage

Is it a deviation — or expected process behaviour?

Ask in plain language. The copilot pulls the live tags, checks the CPP bands in your SOP, distinguishes a genuine excursion from normal batch physiology, and hands you the documented rationale.

Asked of the live demo bioreactor:
“BR-401 dissolved oxygen is drifting down. Is this a deviation?”

Not a deviation (currently). DO is declining but within the expected, controlled band — normal fed-batch behaviour per SOP-BR-201.

Evidence: DO 42.4% → 38.3% over 48 h; no anomaly windows or stuck-instrument flags; DO inversely correlated with agitator speed (r = −0.53), which climbed 178 → 197 rpm — exactly the cascade the SOP describes for rising oxygen uptake. Temperature and pH both in band.

Escalate only if DO < 30% sustained > 15 min, or temperature/pH leave their bands. None breached — no deviation triggered.

Verbatim from the live demo. Your SOPs, CPP bands and thresholds replace ours.

Alarm triage in a flood

One tap groups active alarms by likely common cause, ranks the actionable one first, and names the alarms that can be deprioritised — with the chattering tags flagged for rationalisation review.

Batch & shift narratives

Shift handover and daily briefings written from live data: excursions with timestamps, alarms, watch items and actions — a drafted starting point for the batch-record narrative, not a blank page.

Golden batch comparison

Compare the running campaign against historical profiles to see divergence while the batch is still in progress.

Built for regulated environments

Designed to support your data-integrity requirements

SmartPlantIQ is decision-support software. It does not write to your control system, and it is architected so that every answer it gives can be traced, reviewed and retained.

Advisory-only

No setpoint writes, no closed-loop control, no actuation — a materially lighter validation burden than control software.

Traceable answers

Every finding cites the tags, values and time windows behind it, plus the SOP it references. Nothing is asserted without its evidence.

Audit trail & access control

Every question and answer is recorded with user and timestamp; role-based access separates viewer, engineer and administrator rights.

On-premise deployment

Runs inside your network alongside your historian — process and batch data never has to leave the site.

On qualification: SmartPlantIQ provides the technical controls above — audit trails, access control, electronic records, model change control and traceable outputs — to support your computerised-system validation and data-integrity (ALCOA+) programme. Qualification of the system in your environment (IQ/OQ/PQ) is performed jointly with your quality unit as part of a pilot. We do not claim certification on your behalf.

How engagements start

A single unit, a defined success metric, weeks not quarters

STEP 1 · WEEK 1–2

Historian export

Start from CSV exports of one unit — no control-system integration, no firewall changes. We build the asset model and agree the success metric with your team.

STEP 2 · WEEK 3–8

Soft sensor & copilot pilot

We train the PAT model against your lab history, stand the copilot up on your SOPs, and run it alongside the shift — advisory, in parallel with existing practice.

STEP 3 · WEEK 9–12

Measure & decide

Review prediction accuracy against lab, time-to-triage against baseline, and the deviation record — then decide on rollout with your quality unit.